How to Design a One-Page Market Report Your Team Will Actually Read

Most market reports die quietly. They get opened once, skimmed on a phone, filed somewhere, and never mentioned again. The analysis is often fine. The format is the problem: twenty pages that each make a small point, none of which adds up to a decision.
A one-page report forces a different discipline. You cannot hide behind breadth. You have to decide what matters this month, show the evidence for it, and say what should happen next. That constraint is the whole value. What follows is a workable way to build that page, from the headline down to the last action item.
Lead with a headline that makes a claim
The top of the page is not a title, it is a conclusion. "Q3 Market Update" tells the reader nothing and gives them no reason to continue. "Discounting is spreading in the mid-market and our win rate is slipping with it" tells them exactly what the page is going to prove. They can agree, disagree, or ask a question — all three are good outcomes.
Write the headline as a full sentence with a subject, a verb, and a direction. If you cannot imagine anyone arguing with it, it is too soft. "Costs are rising" is a fact. "Input costs will compress margins by the end of the quarter unless we reprice the entry tier" is a position, and positions get read.
Under the headline, add one line of context: the period covered, the segment, and the source of the data. Three or four words each. This is the line that stops someone from misreading the chart below it.
Choose fewer metrics than feels comfortable
Three to five numbers is the practical ceiling for a single page. Every additional metric divides attention. The ones that stay should each be able to answer three questions: what is the value now, which way is it moving, and how does that compare with something meaningful — last quarter, the plan, a competitor's disclosed figure, a customer segment.
When you are deciding what earns a place, run each candidate through this filter:
- Does it change a decision? If the number moved sharply and nobody would do anything differently, it belongs in an appendix.
- Is it comparable? A metric you cannot measure the same way next month is a one-off curiosity, not a trend.
- Can someone else verify it? Note the source in a footnote line so a sceptical reader can check it without emailing you.
- Is it ours or the market's? Both matter, but mixing them in the same row invites confusion about cause and effect.
Vanity numbers — total addressable market, cumulative sign-ups, page views — tend to fail all four tests. They feel reassuring and inform nothing.
Let the visual evidence carry the argument
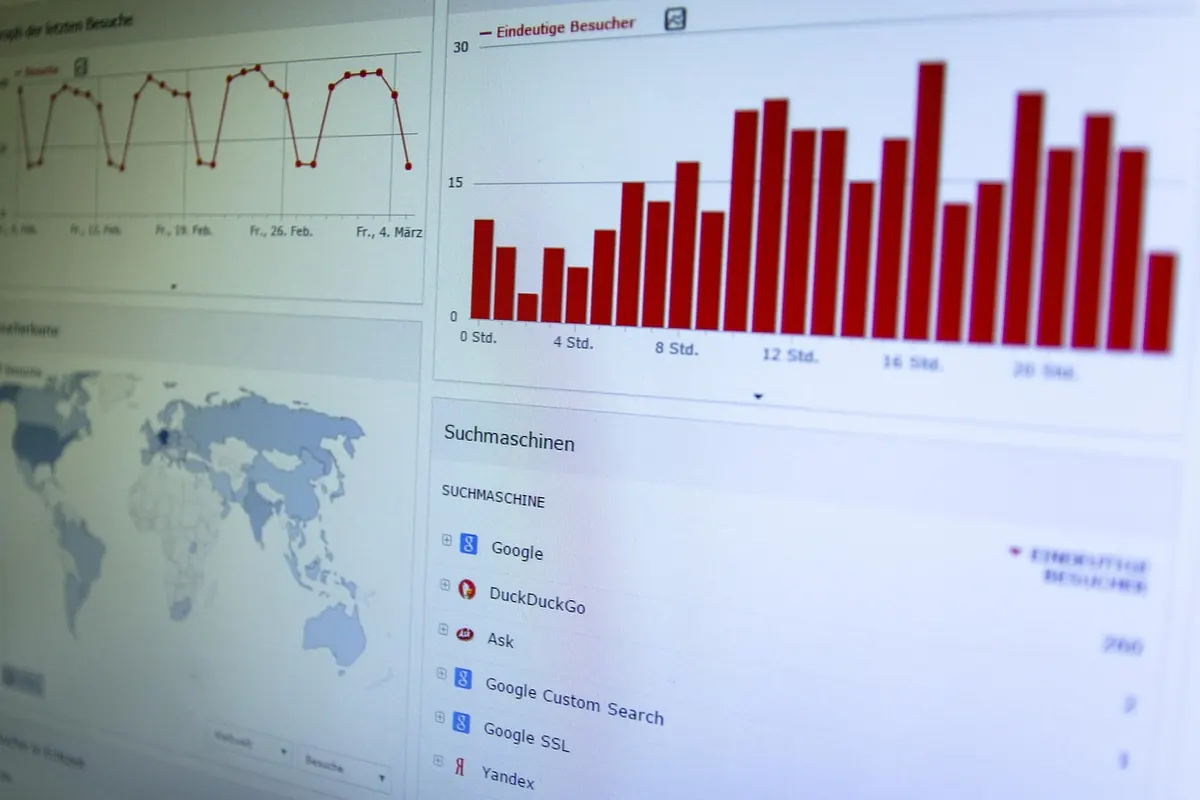
One chart, two at most. Each chart should make a single point, and the point should be in the chart's own title: "Lead times have doubled since April," not "Lead times, indexed." A reader who only looks at the chart title should still get the argument.
Match the form to the question. A line chart answers "what direction and how fast." A bar chart answers "which one is bigger." A small table answers "exactly how much, and by when." Resist the pie chart with nine slices, the dual axis that lets two unrelated series appear correlated, and any three-dimensional effect. These are not stylistic preferences; they are ways a chart can mislead.
Annotate the moment that matters. A single vertical line marking a price change, a competitor's launch, or a policy shift does more explanatory work than three paragraphs of commentary. Label the axes, put units in the labels, and check the page in greyscale — a good share of readers will print it or view it on a dim screen.
Write the interpretation in plain sentences
Under the chart, two or three sentences: what is happening, why you think so, and what you are still unsure about. Keep fact and inference visibly separate. "Channel checks suggest distributors are holding more stock than usual" is an inference and should read like one. "Reported inventory days rose from 41 to 53" is an observation.
Naming the uncertainty is not weakness, it is what makes the confident parts believable. A short line such as "the sample is small and skews to the north" protects both you and the reader. Strip the jargon while you are at it: "customers are trading down" beats "adverse mix migration in the value tier" every time, and it survives being forwarded to someone outside the team.
Finish with actions, owners, and a trigger
The bottom third of the page is where most reports go soft. Replace "recommendations" with a short numbered list of what happens next. Two or three items, no more, each with a named owner and a date.
- Reprice the entry tier for new contracts — owner named, decision by the 15th.
- Run a win/loss review on the last ten mid-market deals — owner named, summary at the next commercial meeting.
- Track distributor inventory weekly until it falls below the seasonal norm — owner named, reviewed monthly.
Add one line on what would change your mind: "if inventory days fall for two consecutive months, the pricing action can wait." That single sentence turns a static document into something the team can monitor, and it stops the same debate from restarting from zero next month.
A layout that holds together
Top to bottom, the page reads: headline and context line; a row of three to five metrics with direction arrows and comparisons; the main chart with its message as a title; two or three sentences of interpretation; the action list with owners and dates; a small footer noting source, period, and who prepared it. That is roughly 150 to 250 words plus one visual, which fits comfortably on a single page at a readable size.
Keep a template and reuse it. Consistency is what makes the second, third, and twelfth report fast to read — readers learn where to look and stop hunting.
Test it before you send it
Three quick checks catch most problems. First, read the page aloud in under a minute; if you run out of breath or start explaining, cut something. Second, hand it to one person who was not involved and ask them what they think the main message is. If they name a different message than your headline, the headline is not doing its job. Third, print it. Anything that disappears in greyscale or spills onto a second page needs trimming.
Then send it with a short note in the body of the email rather than as an attachment alone, so the argument travels even if the file is never opened. Date the page and keep the old ones in one folder; a run of twelve of these becomes a genuinely useful record of how your market moved and what you did about it.
Photo: Goumbik / Pixabay